Being Popular Ain’t Everything
Categories: analytics
Plenty of people on LinkedIn know me as that guy that posts about the popularity of different analytics tools. Like a discount Gartner Research with occasional ska memes. I’ve shared a lot of tables like the following, which compares usage data from Feb 2026 to 2025.
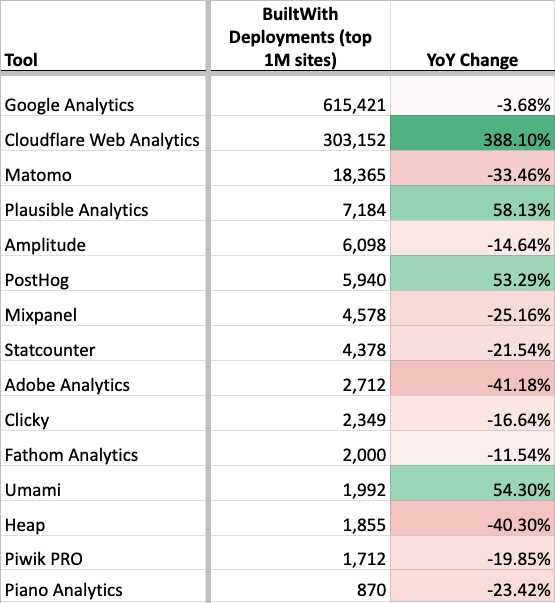
This table shows the number of installs that website research tool BuiltWith detected among the top 1M websites, compared to how many they detected a year ago. Since the first edition of my Google Analytics alternatives book was released in 2022, I’ve posted something like the above every few months on LinkedIn. Despite these posts being quite successful (in terms of visibility and engagement), I stopped posted them in 2025 ahead of the release of the 2nd edition of my book.
Like many things in analytics, the numbers have been more complicated in recent years, and I felt the accuracy had declined too much. The numbers remain useful for many things, but are subject to a lot of misinterpretation and caveat.
For example, the chart above tells a lot of stories that I think are true and instructive:
- GA remains ubiquitous, though its installation base may have declined slightly.
- Plausible, PostHog, and Umami have recently gained a lot of installs.
- Matomo remains broadly popular.
It also implies some things that I think are likely not true.
- Initial read: Cloudflare Web Analytics is extremely popular.
Likely explanation: Cloudflare Web Analytics is free and part of a very popular ecosystem. It became enabled by default on Cloudflare-proxied domains as of Oct 2025. Anecdotally, I’ve never seen it actively used for reporting and it lacks the features to do so. - Initial read: Aside from Cloudflare, installation of analytics tools overall is down.
Likely explanation: Crawling is getting harder, and stock client-side installations are becoming less common. Overall detection is much more difficult. - Initial read: Adobe had a very bad year.
Likely explanation: Adobe’s detection logic in BuiltWith is outdated.
BuiltWith is not the only source of this data. I’ve also looked at data from: Wappalyzer, W3Techs, Datanyze, and Ghostery. They all tell slightly different versions of the same data: GA is the only ubiquitous tool and there’s the same group of tools in a somewhat different order lined up behind it.
| BuiltWith (top 1M) | Wappalyzer (all) | W3Techs (all) | |
| GA | #1 | #1 | #1 |
| Matomo | #3 | #3 | #2 |
| Amplitude | #5 | #9 | #7 |
| PostHog | #6 | #4 | #6 |
Since I haven’t found any of those other sources to be superior, and because BuiltWith has a good historical data API, I chose to continue to use BuiltWith in the 2nd edition of my book. I chose to no longer highlight trending data or exact rankings of tools in the book however.
Next I decided to do what any curious data nerd would do: create my own source of data to confuse things even further validate the existing dataset.
For ease of implementation and so I could look into the raw data per site, I decided to focus on the top 10K sites rather than the top 1M. Here are my results compared to what BuiltWith says.
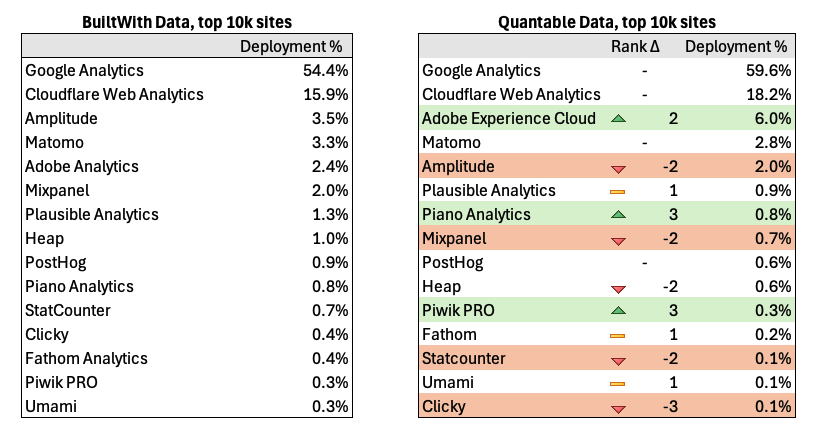
The good news is that my results are overall pretty similar to BuiltWith and validates the general shape of their numbers, if not the fine details.
The fun (?) part about retrieving your own data is that you can inspect exactly what the logic was and investigate discrepancies more thoroughly.
Counting Discrepancies
Adobe was undercounted by BuiltWith. Since we’re dealing with the top 10k sites, we should expect to see a fair amount of Adobe, and in my crawling I did. I based my tracker identification off of Ghostery’s TrackerDB, which included more domains for Adobe. I also added some additional rules. In BuiltWith’s defense they are claiming to identify “Adobe Analytics” specifically, whereas the Ghostery rules are for tracking “Adobe Experience Cloud” more broadly. Because measurement that ends up in Adobe Analytics can actually be sent via an Adobe Experience Cloud endpoint: telling the types of Adobe measurement requests apart can be hard if not impossible. The same thing is true of many platforms, which shows the difficulty of the overall endeavor!
I counted less instances of Amplitude than BuiltWith. BuiltWith was likely more accurate here. BuiltWith and I both started from the Tranco list of top websites, but we deduped sites differently. I de-duped based upon top-level domains, and just crawled the homepage. For example if I saw quantable.com and app.quantable.com in the list, I only used quantable.com. Since Amplitude has relatively more market share in product analytics, this means I missed some of the cases where the “app” or product existed on a subdomain or interior page (I was able to validate this comparing the lists of domains). This probably also affected Mixpanel and Heap.
I detected more instances of Piano and Piwik PRO. I believe in both cases BuiltWith may be missing some endpoints that aren’t operating on the standard domains. The default configuration of Ghostery’s TrackerDB actually detects even more as Piano Analytics, because it counts all calls to piano.io, even though many calls like those to https://c2-eu.piano.io/xbuilder/experience are counted as Piano Analytics but they are a different part of Piano.
Managing all these detection rules (I counted over 8,000 in Ghostery) is a thankless task. It’s actually sort of amazing to me that the rules in databases like Ghostery’s or EasyList are as good as they are considering there’s not much economic incentive to manage those lists well. Shoutout to Brian Clifton and his tool Verified Data for helping to maintain the Ghostery list, particularly in the category of analytics his contributions made my data more accurate here.
Yes, these details are kind of stultifying. No, the rest of the article isn’t going get any better.
What’s Breaking My Crawler Now??
Let’s talk about the challenges of acquiring this data. Detecting client-side analytics tooling has always been challenging, but there’s a few things that have really upped the difficulty in recent years:
Consent Management Platforms and other site gates
Many sites require you to click “Accept” before they place tracking. Though that % is a lot less than you might think, especially in the US. Still the crawler has to know how to click “Ok”, “Agree”, “Tout Accepter”, “Qapla'”, or whatever. (ok nerds, I know Qapla’ means “Success” and not “Ok” in Klingon, please stop messaging me)
Many popular sites also happen to gate their site to users over 18 years old. The crawler has to know how to click past that too. Don’t worry, I told Claude to cover its eyes when it looked at those sites.
My solution: Using the Autoconsent extension by DuckDuckGo within Playwright in addition to some manual rules trying to click on modals.
Anti-bot
Any automated crawl is going to get blocked or captcha’d sometimes. Especially if you’re trying to crawl the top sites on the web you might get blocked a lot. It’s also hard to know if you got blocked vs. if the domain on the Tranco list wasn’t actually a website, or if it was broken, etc.
My solution: connecting Playwright to a real browser (not the built-in Chrome in headless mode) inside a docker container, and then escalating to an external smart proxy service if that method was still blocked. This was able to unblock nearly all sites. I have mixed feelings about proxy services like that since they also can be misused, but for my purposes here we’re only talking about a few hits.
Anti Ad-block & Server-side Analytics
Nobody wants their tracker blocked, so there’s a myriad of ways that trackers can be configured to avoid detection by adblockers, cookie restrictions, etc. These same methods also make it much harder to detect when crawling. This is well-illustrated by my crawling here that uses the exact same detection database used by a popular ad blocker (Ghostery).
Server-side of course has other benefits aside from avoiding tracker blocking, but that’s generally the impetus.
My solution: additional rules looking for measurement requests that match trivial proxying. For example, if I saw a fetch/XHR request with a payload that started with:
{“n”:”pageview”,”v”:\d+,”u”:$URL
I could tell that was very likely to be Plausible, as that’s what a standard Plausible measurement protocol request payload looks like. Or if I saw a request sent to a URL like:
https://ss.example.com/g/collect?v=2&tid=G-xxx
then that’s most likely GA4 sent via a server-side GTM container.
More broadly I tried to detect any use of “server-side” by looking for fetch requests that resembled analytics measurement payloads in general that were sent to first-party endpoints. I also tried to unmask CNAMEs of popular server-side providers like Stape, Taggrs, Elevar, Northbeam, etc. Those are not included in my results unless it was clear what tool was being used. In other words, if you were sending GA4 via an ssGTM container I was able to detect it, but I didn’t attempt to unmask more customized measurement setups.
My testing showed about 20% of the top 10k using something that looked like server-side analytics, but the details of that is a whole different article, and not my primary purpose here.
Mandatory AI Section of the Article
When the first edition of my book came out in 2022, I thought about validating the BuiltWith numbers, but the amount of coding seemed too much to make it worthwhile. With Claude doing the heavy lifting on writing the code this time, it suddenly felt very doable.
AI can be a huge productivity trap. AI tools make you feel like you can take on all kinds of projects, but should you? It’s like coming home from the store saying you saved $300 because you bought a $1,000 guitar you didn’t need because it was on sale for $700.
The 90/90 rule is back. There’s an old joke in programming that the first 90% of code accounts for the first 90% of development time, and the remaining 10% accounts for the other 90% of development time. Yes, that adds up to 180% — because software development always takes longer than you think. With AI-assisted development I find that AI is very helpful with that first 90%, but not very helpful at all with that second 90%.
AI doesn’t help underlying data sources and may in fact endanger them. Identifying all of those trackers would not have been possible without the Ghostery DB. Out of curiosity I asked Claude to create some rules and they were really bad and much too general.
The kind of find-grained differences that are in that curated database are not something well-managed by an AI. In fact I’m embarrassed to say that Claude Code submitted a pull request back to the core project with a rule that it should not have. I had explicitly told it not to do that, but it did it anyway. The PR was rightfully rejected by the maintainers, but I felt guilty for wasting their time with mislabelled rules submitted under my name.
Moderately Contrived Conclusions
- I don’t plan on continuing my “top 15 tools” LinkedIn post series, at least not until I get really desperate for post engagement / dopamine.
- I plan to contribute to open, human-curated databases like Ghostery’s Tracker DB.
- I’ll think more carefully about what “productivity” really means, since lines of code and green boxes on the github activity timeline mean less than ever.
No comments yet.